
Mobile EV charging statistics in the United States reveal a fast shifting ecosystem where demand, infrastructure gaps, and on demand charging services are expanding at record speed, creating both urgency and opportunity for drivers, fleets, and nationwide providers.
EV Charging Market Size and Mobile EV Charging Growth Trends
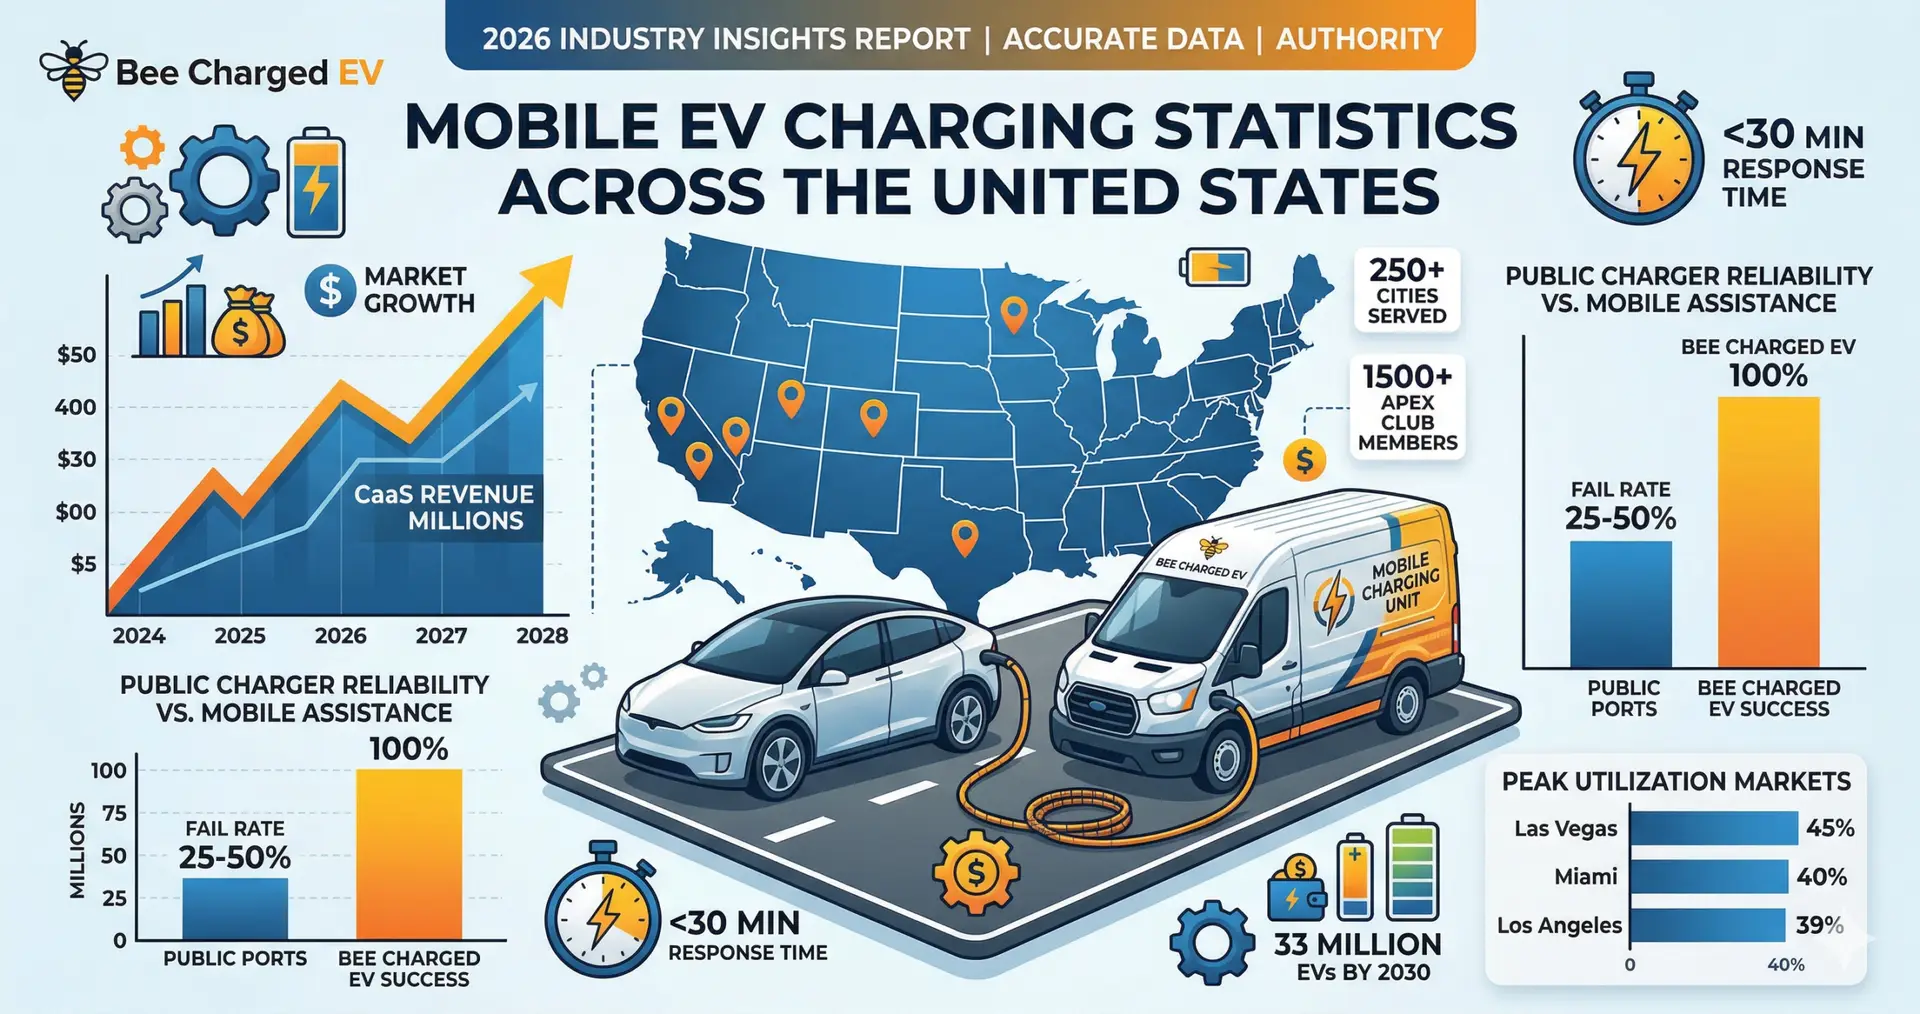
The U.S. EV charging as a service market shows strong upward momentum, directly influencing mobile EV charging adoption and expansion.
- U.S. CaaS market reached 268.32 million USD in 2025
- Projected to reach 425.88 million USD by 2030
- Alternative estimate shows 546.1 million USD by 2033 at 9.5 percent CAGR
- Global CaaS expected to hit 16.8 billion USD by 2036 at 20.5 percent CAGR
Portable and mobile charging solutions are accelerating:
- Level 2 portable charger market at 1.41 billion USD in 2024
- Portable EV charger market projected 234.9 million USD by 2034 at 16.17 percent CAGR
EV Charging Infrastructure vs Mobile EV Charging Demand Gap
Infrastructure growth is strong, but still uneven. This gap explains the rise of mobile EV charging services.
- 326,000+ public charging ports in U.S. as of February 2026
- 70,000+ DC fast charging ports by end of 2025
- 77,148 charging locations nationwide
- 18,041 new DC fast ports added in 2025 alone
Yet, coverage is inconsistent:
- Only 35 percent of interstate highways have chargers every 50 km
- Compared to 75 percent coverage in Europe
Critical insight
If infrastructure were enough, mobile EV charging would not scale this fast. The gap between availability and accessibility is the real driver.
EV Adoption Statistics Driving Mobile EV Charging Usage
The growth of EV adoption directly increases demand for emergency and on demand charging.
- 2.44 million battery electric vehicles registered in 2024
- 1.6 million EV sales in 2024
- Projected 2.25 million EV sales in 2025
- EV share of new vehicle sales expected to reach 26 percent by 2030
Fleet electrification is even more aggressive:
- 27.36 percent CAGR growth in delivery and logistics fleets
- 17,000+ private chargers deployed by Amazon across 120 warehouses
Think about it,
More EVs on the road means what happens when they run out of charge away from home or a station?
That is where mobile EV charging becomes essential, not optional.
Mobile EV Charging and Roadside EV Assistance Statistics
- 160,000 EV roadside assistance calls recorded by AAA in 2023
- Over 7123 calls recorded between end of 2025 and early 2026 by Bee Charged EV
- Mobile charging adds 19.25 miles in 30 minutes on average
Public charging reliability issues further drive demand:
- 25 percent to 50 percent of public chargers may fail or be unavailable
- 14 percent non charge visit rate in 2025
Insight
Mobile EV charging is not competing with infrastructure. It is solving its failures.
EV Charging Behavior and Mobile Charging Opportunity Statistics
Understanding how people charge EVs reveals where mobile services fit.
- 65 percent of EV miles charged at home in North America
- 78 percent of drivers have private home charging
- 95.9 percent have access to some form of home charging
However:
- Workplace charging demand is rising rapidly
- Public charging sessions reached 141 million in 2025
Key observation
Mobile EV charging is strongest in three scenarios:
- Emergency roadside situations
- Urban areas with high utilization
- Fleet operations with operational downtime costs
EV Charging Utilization Rates and Mobile Service Efficiency
- Network utilization at 16.4 percent in 2025
- Level 2 utilization increased to 14.6 percent
- DC fast utilization increased to 12.9 percent
Peak markets:
- Las Vegas 45.5 percent utilization
- Miami 40.2 percent
- Los Angeles 38.6 percent
Implication
High utilization means congestion. Congestion creates wait times. Wait times create demand for mobile EV charging.
EV Charging Cost Statistics and Mobile Charging Economics
- Average DC fast charging price 0.49 USD per kWh
- Average session energy 37.5 kWh
- Daily throughput per charger 370 kWh
Subscription models are expanding:
- 47.15 percent of market uses subscription based charging
- Average monthly subscription around 200 USD per Level 2 station
Strategic insight
Mobile EV charging combined with subscription models creates predictable revenue and faster response ecosystems.
Bee Charged EV Statistics and Nationwide Mobile EV Charging Leadership
Bee Charged EV demonstrates how fast mobile EV charging can scale when demand meets execution.
- 250+ cities covered across the United States
- Presence across all 50 states
- Expansion into Mexico City
- Coverage surpasses traditional roadside providers in mobile EV charging reach
Operational metrics:
- Under 30 minute average response time
- 4.9 out of 5 customer rating
- 24 by 7 nationwide availability
Fleet capabilities:
- 450 fleet vehicles charged in 60 days across 15 states
- One unit supports 15 to 20 vehicles daily
Charging performance:
- 50 to 100 miles added in 15 to 30 minutes with DC fast charging
- Up to 150 miles per hour depending on equipment
EV Charging Reliability and Mobile Charging Advantage
Reliability remains one of the biggest barriers in EV charging.
- Charger uptime at 92.3 percent
- First try success rate only 55 percent
- Customer satisfaction scores declining slightly
Why mobile EV charging wins here
- No dependency on fixed infrastructure
- On demand deployment
- Real time problem solving
It directly eliminates failed charging attempts.
Future EV Charging Projections and Mobile Charging Role
Looking ahead to 2030:
- 33 million EVs expected on U.S. roads
- 28 million charging ports required
- 182,000 DC fast charging ports needed
Breakdown:
- 92 percent home chargers
- 7.6 percent Level 2 public and private
- Around 1 percent DC fast charging
Critical gap
Even with 28 million chargers, mobility and accessibility issues will still exist.
Mobile EV charging will fill:
- Rural coverage gaps
- Emergency roadside demand
- Fleet downtime reduction
- High density urban overflow demand
EV Mobile Charging Industry Perspective and Final Analysis
Mobile EV charging statistics in the United States show a clear pattern:
- EV adoption is accelerating faster than infrastructure reliability
- Charging availability does not equal accessibility
- Utilization hotspots create service demand spikes
- Failure rates create immediate need for mobile solutions
Final thought
The question is no longer whether mobile EV charging is needed.
The real question is how fast it will become a standard part of EV ownership.
Additional Resources
- fastest growing EV charging segment insights
- EV driver behavior and mobile charging data
- U.S. EV charging infrastructure data by Department of Energy
- EV roadside assistance statistics and trends by AAA
- EV charging network usage and energy data by Electrify America
Frequently Asked Questions
Mobile EV charging aligns with CaaS growth, which is projected to grow between 9.5 percent and 20.5 percent CAGR depending on segment and model.
Out of charge incidents represent about 2.1 percent of EV roadside assistance calls, but they require immediate solutions.
The U.S. CaaS market is valued at over 268 million USD in 2025 and continues to grow steadily.